System generates data trending reports and graphics at the click of a button with various filters on samples and test parameters, trend graphs in OasisLIMS display target values, warning levels, and out-of-specification limits.
For process industry, OasisLIMS provides on-line trending capabilities that allow real-time updates of production process on active dashboard so that you can evaluate current processes stage
that captures and generates alerts on the event of out of trend limits to help identify production issues long before occurance of any failure.
• Trend analysis provides graphical and tabular representation of resultant data of different batches to study the behavioral trend of a product over a period of time.
• It generates a comprehensive report as per the user's choice of parameters.
• Printing report gives a comparative analysis of batches on user-defined parameters along with the specification details in a standard spreadsheet format and a graph as well with warning limits and resultant data points.
• Built in functions to export report in spread sheet to further work on data.
Trend analysis data can be used to evaluate vendor to monitor supplies received over a period for critical praramters LOD, Moisture and Assay/Potency.
Trending data produces a comparative analysis of batches on user defined parameters along with the specification details in a standard spread sheet like format.
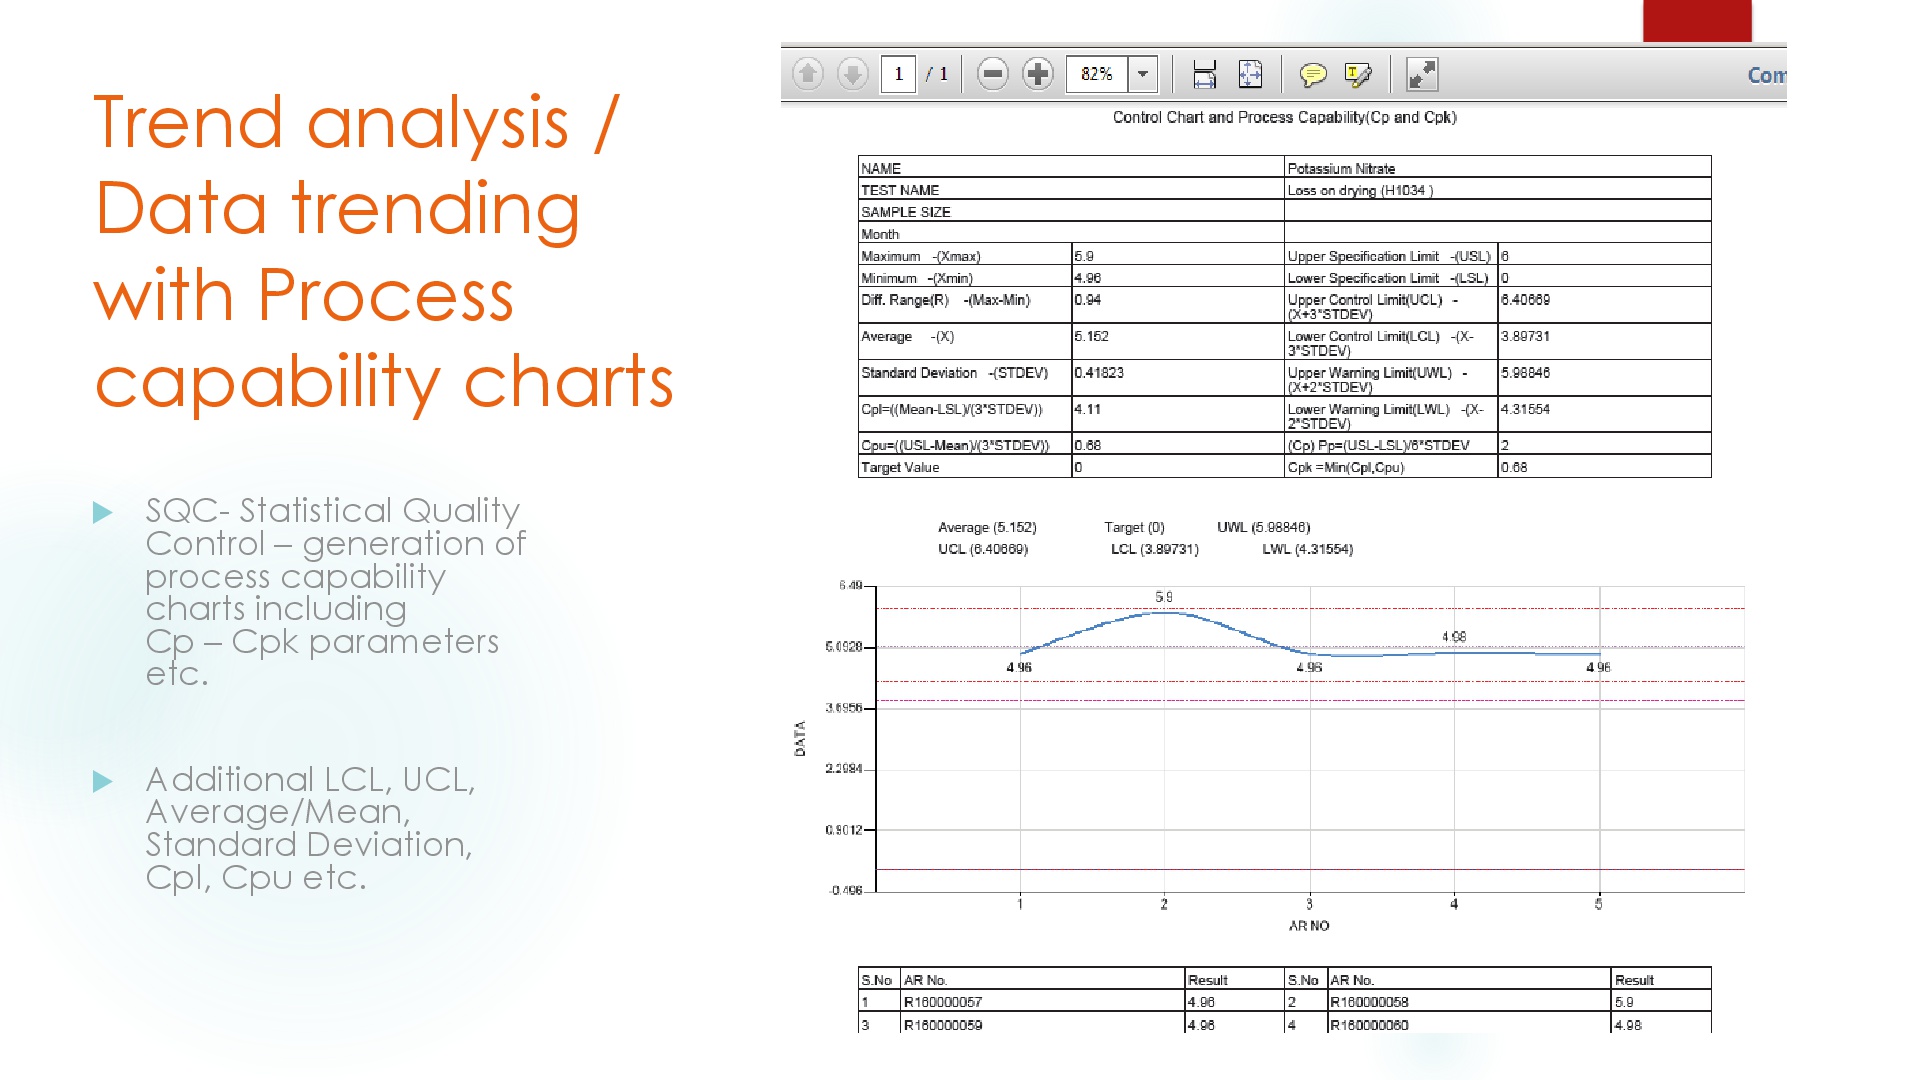
In addition, OasisLIMS also includes Statistic Quality Control (SQC) tools functions that generates process capability information with an option for extrapolation of trending data along with mean, median, max, min,
the graph can incorporate linear line / logarithmic curves.